🖥️ WebUI Overview
The MOS web interface provides a centralized management dashboard for monitoring system health, managing storage, and operating services such as Docker, LXC, and virtual machines. The interface is divided into three main areas:
| Area | Description |
|---|---|
| Top Bar | Global status and quick access |
| Left Navigation Menu | Main system sections |
| Main Content Area | Detailed views and controls |
🔝 Top Bar
The top bar is always visible and provides quick access to global functions.
- MOS Logo — Returns you to the Dashboard from any page.
- Docs — Direct link to the MOS Docs page for help
- Notifications — Displays system alerts, warnings and important events.
- User Settings — Displays user profile settings such as “Dark Mode”, “Language”, etc.
🧭 Left Navigation Menu
The navigation menu on the left provides access to all major system components.
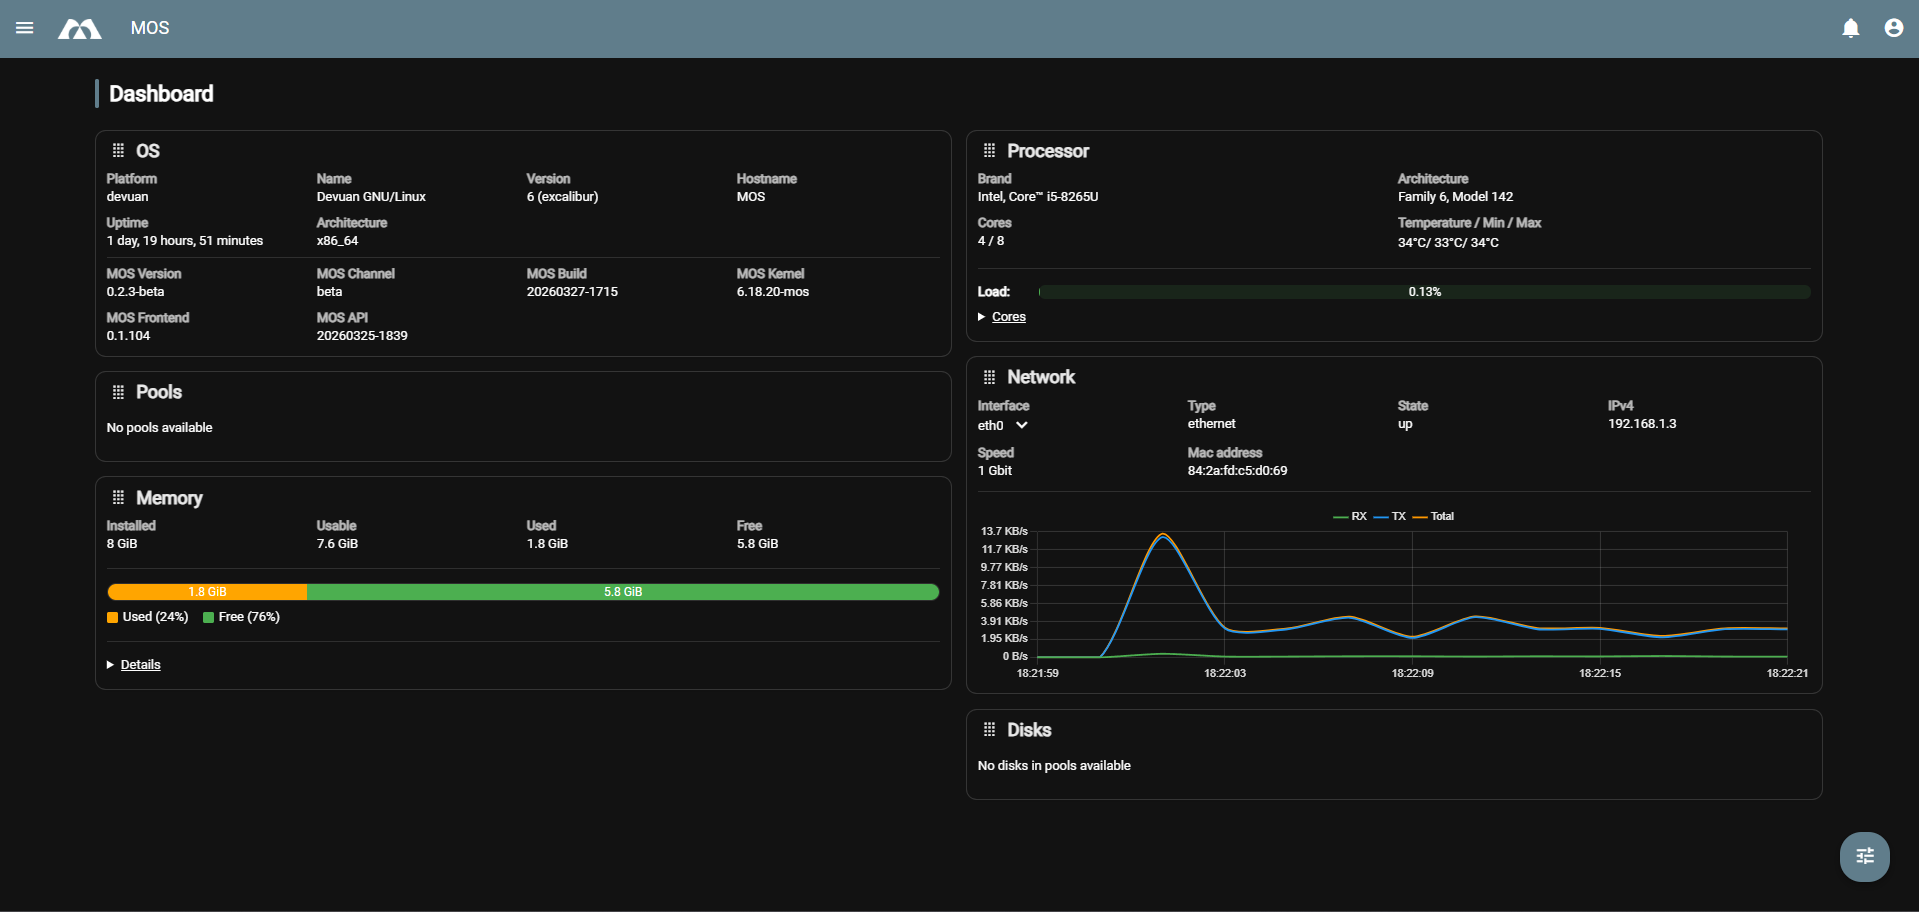
📊 Dashboard
The main system overview page. This is the first place to check overall system health.
Displays real-time information about:
- Operating system and MOS version
- CPU load and per-core utilization
- Memory usage
- Network traffic
- Storage pool usage
- Disk activity and temperatures
- Sensors
💽 Disks
Lists all detected physical storage devices. Here you can:
- View disk health and temperatures
- Identify devices
🗄️ Pools
Used to create and manage storage pools. From this section you can:
- Create new pools
- Assign disks to pools
- Monitor pool usage and status
Pools are the foundation for shares, containers and virtual machines.
📂 Shares
Manages shared folders provided by the system. Typical use cases:
- Network shares (SMB / NFS)
- Media storage
- Backup destinations
Shares are always backed by a storage pool.
🛍️ MOS Hub
Central place for Docker Templates, Docker Compose Templates and MOS Plugins.
🐳 Docker
Manages Docker containers and images. From this section you can:
- Deploy containers
- Start, stop and update services
- Monitor container resource usage
Common use cases include media servers, download services and automation tools.
📦 LXC
Manages Linux Containers (LXC). Used for:
- Lightweight system containers
- Isolated service environments
- Advanced Linux-based workloads
LXC containers behave more like small virtual systems compared to Docker containers.
🖥️ VMs
Manages full virtual machines. Here you can:
- Create and manage virtual machines
- Assign CPU, memory and storage
- Run complete operating systems
Best suited for workloads that require a full OS.
👤 Users
User and permission management. Allows you to:
- Create and manage user accounts
- Assign access rights
- Control permissions for shares and services
🔧 Tools
Provides tools for MOS:
- Power Management (Reboot and Shutdown)
- Terminal
- Filebrowser
👨💻 User Settings
Personal settings for the currently logged-in user. Includes:
- Interface preferences
- Account-related options
⚙️ Settings
Global system configuration. This section is used to configure:
- Network settings
- System behavior
- Security and access control
- Advanced MOS features
🚪 Logout
Ends the current session and returns to the login screen.
📋 Dashboard Panels Overview
The Dashboard displays multiple information panels providing a real-time system overview.
| Panel | Description |
|---|---|
| OS Panel | Displays operating system details, MOS version, kernel, uptime and hostname |
| Processor Panel | Shows CPU model, architecture, temperature, load and per-core utilization |
| Memory Panel | Visual overview of RAM usage, including system processes, Docker, LXC, cache and free memory |
| Network Panel | Displays real-time network traffic for active interfaces |
| Pools Panel | Shows storage pool usage and capacity |
| Disks Panel | Displays disk activity and temperature for active devices |
| Plugin Widgets | Additional dashboard panels provided by installed plugins (e.g. DVB drivers, Nvidia GPU, Sensors) |
🧩 Plugin Widgets
Plugins can provide additional dashboard widgets that display relevant information directly on the Dashboard.
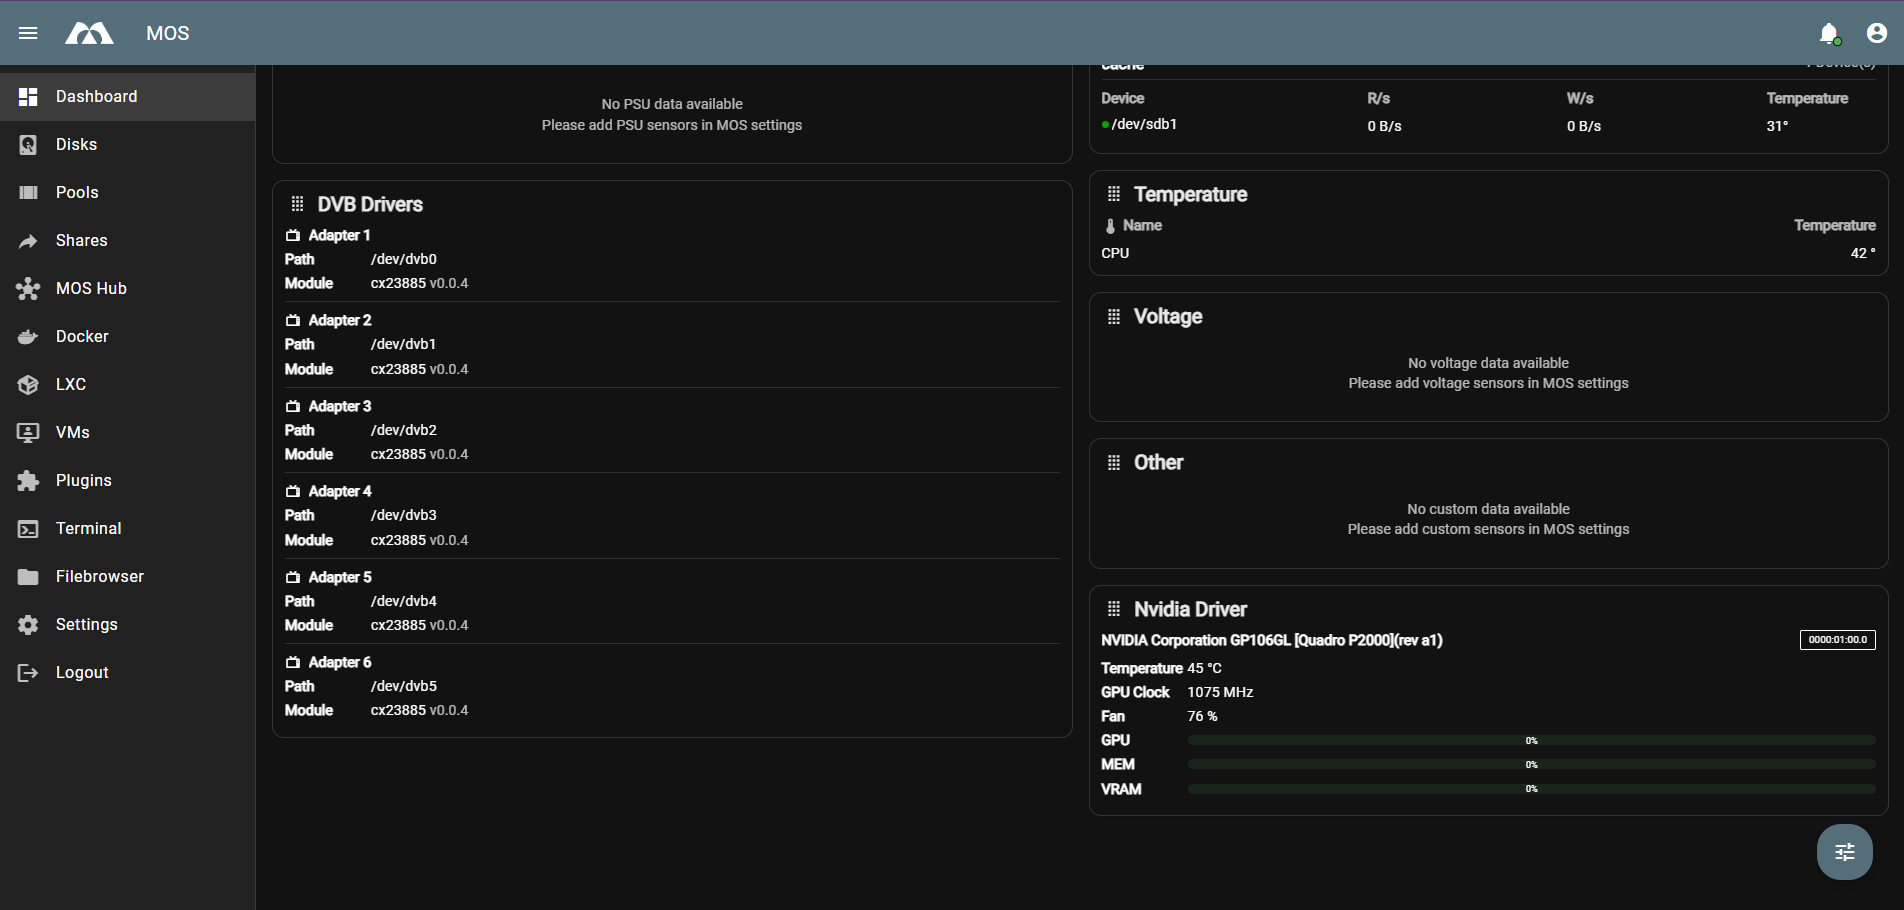
Examples shown above include DVB adapter info, GPU stats (Nvidia), temperature, voltage and other sensor data.
Visibility Control
Each plugin widget can be toggled on or off individually using the visibility menu in the bottom right corner of the Dashboard.
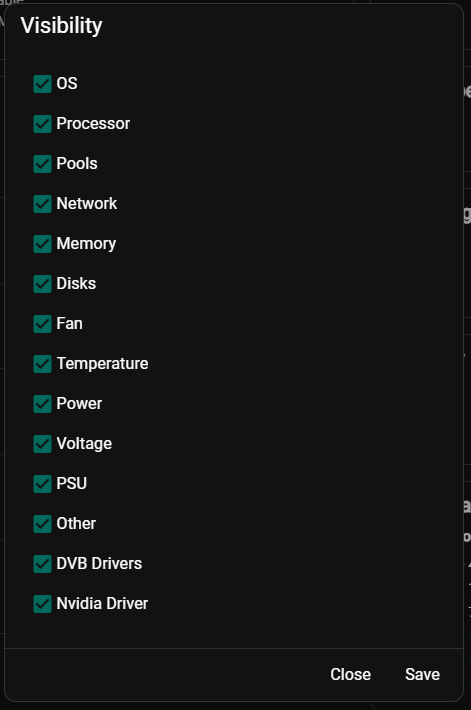
Not all plugins support dashboard widgets. Only plugins that provide widget support will appear in the visibility menu.
🔐 Login Rate Limits
The WebUI implements rate limits for the login area to protect the system from brute-force attacks.
Configuration
Login rate limits are configured via environment variables in the file /boot/config/api/env.
| Variable | Default Value | Description |
|---|---|---|
RATE_LIMIT_MAX_LOGIN | 5 | Maximum number of failed login attempts |
RATE_LIMIT_LOGIN_WINDOW | 15 | Time window in minutes during which the maximum attempts are allowed |
RATE_LIMIT_LOGIN_BLOCK | 30 | Block duration in minutes after exceeding the limits |
How It Works
- A user has
RATE_LIMIT_MAX_LOGIN(default: 5) login attempts withinRATE_LIMIT_LOGIN_WINDOW(default: 15 minutes) - After exceeding the limit, the account is blocked for
RATE_LIMIT_LOGIN_BLOCK(default: 30 minutes) - The counter is reset in the following cases:
- API restart
- Server restart
- Successful login
Example
Default configuration:
- Maximum of 5 failed login attempts in 15 minutes
- After 5 failed attempts: 30 minutes block
Changes to the configuration require a restart of the API or the server to take effect.
✅ Summary
The MOS WebUI is designed to provide:
- Immediate visibility into system health
- Clear separation of storage, services and virtualization
- Scalability from simple setups to advanced server configurations
For most users, daily interaction will focus on:
Dashboard → Pools → Shares → Docker → Settings
Parts of this documentation were created with the assistance of AI tools. All AI-generated content has undergone review, but it may still contain inaccuracies, omissions, or outdated information.